Stats
Hitting Leaderboard
Rank Player Team Position G AB R H 2B 3B HR RBI BB SO SB AVG OBP SLG OPS 1 Nick Zambrotta IBL Sub Players 1 1 0 1 0 0 0 0 1 0 0 1.000 1.000 1.000 2.000 2 Alexander Troum Reds 12 36 14 20 2 0 0 7 0 3 8 0.556 0.553 0.611 1.164 3  Ryan Kelly
Islanders Outfield 14 36 19 19 6 0 2 21 4 1 5 0.528 0.646 0.861 1.507 4  Matt Williams
Islanders Pitcher, Short Stop 9 21 10 11 2 0 1 9 3 0 1 0.524 0.583 0.762 1.345 5  Jarus Samagaio
Storm Catcher, Outfield, Pitcher 13 32 6 16 1 0 0 9 2 7 3 0.500 0.543 0.531 1.074 6  Matt Capone
Storm Outfield, Pitcher, Third Base 13 30 13 15 5 0 1 11 3 2 1 0.500 0.615 0.767 1.382 7  Josh Sokol
Storm Outfield, Pitcher 14 39 17 19 3 1 3 7 5 3 7 0.487 0.565 0.846 1.411 8  Jimmy Costakos
Storm First Base, Third Base 16 37 11 18 4 0 2 15 8 5 1 0.486 0.604 0.757 1.361 9  Jeff Carreiro
Royals Outfield 12 35 11 17 2 0 2 6 4 0 2 0.486 0.538 0.714 1.253 10  Mike Dougan
Navs Pitcher, Short Stop 13 41 19 19 7 0 1 16 4 6 5 0.463 0.500 0.707 1.207 11  Alex Desantis
Royals 2nd Base, Pitcher, Third Base 16 39 16 18 1 0 0 5 5 7 0 0.462 0.549 0.487 1.036 12  Austin Navarro
Reds 12 27 14 12 2 0 0 6 10 4 3 0.444 0.605 0.519 1.124 13  Andrew Salpietro
Reds 12 32 6 14 4 0 0 9 3 5 2 0.438 0.500 0.563 1.063 14 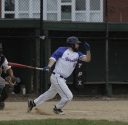 Joey Sanfilippo
Islanders Center field, Pitcher 15 43 11 18 3 0 1 13 8 5 2 0.419 0.510 0.558 1.068 15  Wayne Martins
Reds 14 39 5 16 3 0 1 20 3 3 1 0.410 0.477 0.564 1.041 16 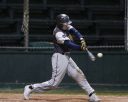 Robbie Harrington
Pirates Catcher, Pitcher, Third Base 14 42 7 17 2 0 0 10 3 4 8 0.405 0.457 0.452 0.909 17  Trent Baltzell
Royals Center field 14 35 12 14 1 0 2 12 4 4 9 0.400 0.500 0.600 1.100 18  Joe Long
Islanders Catcher, Pitcher 9 23 7 9 0 1 0 6 7 3 5 0.391 0.516 0.478 0.994 19  Michael Schuermann
Islanders Outfield, Pitcher 9 26 8 10 2 0 1 3 3 7 7 0.385 0.467 0.577 1.044 20  Greg Ferro
Royals Catcher, Pitcher, Shortstop, Third Base 16 42 8 16 3 0 0 9 8 6 8 0.381 0.471 0.452 0.923 21  Chase Ceglie
Pirates Catcher, Infield 11 32 5 12 1 0 1 10 3 6 0 0.375 0.444 0.500 0.944 22  Steve Schneider
Royals Catcher, Infield, Outfield, Pitcher 14 35 12 13 3 0 0 6 6 6 2 0.371 0.477 0.457 0.934 23  Mike Parente
Reds 11 27 4 10 2 0 0 3 2 5 2 0.370 0.414 0.444 0.858 24  Brandon Dame
Storm First Base 8 22 3 8 0 0 1 4 1 2 0 0.364 0.391 0.500 0.891 25  CJ Silva
Storm Infield, Pitcher 14 36 9 13 2 0 0 1 8 2 4 0.361 0.477 0.417 0.894 26  Zach Greene
Navs Left field, Pitcher 14 39 20 14 4 0 0 10 12 5 3 0.359 0.510 0.462 0.971 27  Eli Estevez
Storm Pitcher, Short Stop 16 42 10 15 8 0 1 7 4 14 9 0.357 0.413 0.619 1.032 28  Brian Crea
Navs Pitcher 15 42 14 15 2 0 3 22 10 4 2 0.357 0.500 0.619 1.119 29  Jerry Pelitier
Reds Pitcher 8 20 6 7 1 0 0 4 7 5 0 0.350 0.500 0.400 0.900 30  Jeff Oberg
Storm Catcher, Infield, Outfield 14 33 7 11 0 0 0 3 7 10 7 0.333 0.476 0.333 0.810 31  Jeff Rodriguez
Royals 2nd Base, Shortstop, Third Base 14 36 3 12 1 0 0 5 2 5 4 0.333 0.368 0.361 0.730 32 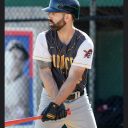 Alex Dresser
Pirates First Base, Outfield 9 18 1 6 1 0 0 2 6 6 2 0.333 0.500 0.389 0.889 33  Steve Sanfillippo
Islanders First Base 10 27 3 9 0 0 0 7 3 6 0 0.333 0.419 0.333 0.753 34 Victor Lahr Islanders First Base, Outfield, Pitcher 16 46 16 15 6 0 4 16 6 12 1 0.326 0.426 0.717 1.143 35  Devin Johnson
Pirates Outfield, Pitcher 14 34 14 11 5 1 2 4 9 9 16 0.324 0.477 0.706 1.183 36  Teddy Horan
Pirates Infield, Pitcher 13 36 10 11 3 0 0 3 7 9 4 0.306 0.444 0.389 0.833 37  Shad Samagaio
Storm Catcher, Infield 12 30 5 9 1 0 0 5 4 9 3 0.300 0.382 0.333 0.716 38  Gary Vaspol
Navs 15 47 8 14 1 0 2 19 4 9 4 0.298 0.382 0.447 0.829 39  Scott Copper
Royals Pitcher, Shortstop 11 24 2 7 1 0 0 3 4 6 2 0.292 0.393 0.333 0.726 40  Matt Bury
Reds 13 31 7 9 0 0 0 4 5 5 0 0.290 0.389 0.290 0.679 41  Russell Forgue
Navs First Base, Pitcher 13 31 10 9 1 0 1 8 8 5 0 0.290 0.452 0.419 0.872 42  Curtis Cord
Reds 12 28 7 8 2 0 0 5 4 6 1 0.286 0.375 0.357 0.732 43  Cody Platt
Islanders Pitcher, Short Stop 6 14 5 4 1 0 0 1 4 3 4 0.286 0.444 0.357 0.802 44 Ian Smith Islanders Shortstop 5 14 4 4 0 0 1 2 1 4 0 0.286 0.375 0.500 0.875 45  James Pierce
Navs Pitcher 13 36 10 10 1 0 0 2 3 6 0 0.278 0.350 0.306 0.656 46 Austin Martin Pirates First Base 11 29 2 8 2 0 0 5 2 3 0 0.276 0.364 0.345 0.708 47  Andy Lima
Islanders Outfield 14 37 2 10 1 0 0 6 5 10 4 0.270 0.372 0.297 0.669 48  Matt Baker
Reds 10 19 5 5 0 0 0 0 2 3 1 0.263 0.364 0.263 0.627 49  Joseph Cassady
Navs 9 19 8 5 1 0 1 5 7 6 0 0.263 0.462 0.474 0.935 50  Alex Croce
Islanders Outfield, Pitcher 11 31 6 8 0 0 2 8 4 7 7 0.258 0.343 0.452 0.794 51  Jake Vaspol
Navs 14 36 8 9 0 0 0 8 10 9 0 0.250 0.438 0.250 0.688 52  Chris Perez
Schooners First Base, Right field 2 4 0 1 0 0 0 0 0 2 0 0.250 0.400 0.250 0.650 53  Scott Emond
Pirates Outfield 14 40 4 10 0 0 0 4 1 8 1 0.250 0.318 0.250 0.568 54 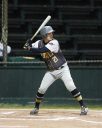 Kevin Rinaldi Young
Pirates Second Base 14 36 7 9 2 0 0 5 8 9 1 0.250 0.400 0.306 0.706 55 Ryan Fallon Islanders 2nd Base, Pitcher 3 8 0 2 0 0 0 1 1 1 0 0.250 0.333 0.250 0.583 56  Todd Bartolomei
Navs Catcher 15 37 12 9 3 0 1 11 11 7 0 0.243 0.429 0.405 0.834 57  David Boelter
Reds 12 29 1 7 1 0 0 4 4 7 0 0.241 0.353 0.276 0.629 58  Steve Farias
Navs Pitcher, Third Base 15 38 11 9 1 0 0 4 6 6 0 0.237 0.370 0.263 0.633 59  Chris Ferris
Pirates First Base 13 31 1 7 0 0 0 3 2 12 0 0.226 0.294 0.226 0.520 60  Mike Berardo
Navs Second Base 12 23 9 5 0 0 0 4 9 7 0 0.217 0.457 0.217 0.675 61  Collin Moriarty
Reds Pitcher 10 19 7 4 0 0 0 2 6 6 0 0.211 0.385 0.211 0.595 62  George Grassi
Reds 10 15 4 3 0 1 0 5 7 6 0 0.200 0.478 0.333 0.812 63  Chuck Cooper
Royals Right field 12 25 3 5 0 0 0 4 3 8 0 0.200 0.310 0.200 0.510 64  Dylan Smith
Pirates Pitcher, Short Stop 9 21 8 4 0 0 2 3 6 7 1 0.190 0.370 0.476 0.847 65  Josh Schneider
Royals Infield, Outfield, Pitcher 15 32 6 6 1 0 0 5 7 10 2 0.188 0.350 0.219 0.569 66 RJ Ritchie Islanders Infield 9 16 3 3 0 0 0 0 3 3 0 0.188 0.435 0.188 0.622 67  Mike Rafferty
Navs 12 27 6 5 0 0 0 2 5 12 2 0.185 0.371 0.185 0.557 68  Marcelo Aracena Rivera
Storm Catcher 13 27 2 5 0 0 0 3 5 5 0 0.185 0.313 0.185 0.498 69 Zachary Rosenfeld Islanders 2nd Base, Right field 16 36 4 6 0 0 0 2 7 16 0 0.167 0.302 0.167 0.469 70  DJ Kadamus
Islanders Catcher, Infield, Pitcher 13 34 4 5 1 0 0 1 5 12 0 0.147 0.256 0.176 0.433 71 Joel DeMarco - 4 7 3 1 0 0 0 1 3 1 1 0.143 0.455 0.143 0.597 72  Jon Vinas
Storm Outfield 14 21 4 3 0 0 0 3 16 12 8 0.143 0.514 0.143 0.656 73  Collin Cord
Reds 11 22 4 3 2 0 0 5 7 13 0 0.136 0.333 0.227 0.561 74  Ross Cooper
Royals 2nd Base, Outfield 13 31 4 4 0 0 0 1 3 11 1 0.129 0.206 0.129 0.335 75  Charles Aboyoun, Sr.
Storm Right field, Third Base 5 8 1 1 0 0 0 0 0 2 0 0.125 0.125 0.125 0.250 76  Jose Vinas Vasquez
Storm Outfield, Pitcher 14 26 2 3 0 0 0 3 8 8 1 0.115 0.314 0.115 0.430 77  Paul Dumas
Storm Outfield, Pitcher 16 37 0 4 0 0 0 1 2 23 0 0.108 0.175 0.108 0.283 78  Rodney Jones
Schooners Right field, Third Base 14 29 2 3 0 0 0 3 3 11 0 0.103 0.257 0.103 0.361 79  Kai Nanfelt
Royals Outfield 5 11 0 1 0 0 0 0 1 4 0 0.091 0.167 0.091 0.258 80  John Hanks
Storm Outfield 15 34 2 3 0 0 0 1 1 22 0 0.088 0.162 0.088 0.250 81  Aaron Prendergast
Royals First Base, Pitcher 13 31 3 2 0 0 0 1 3 19 0 0.065 0.194 0.065 0.259 82 Robert Russell - 10 19 3 1 0 0 0 0 2 11 0 0.053 0.143 0.053 0.195
Hitting Leaderboard
| Rank | Player | Team | Position | G | AB | R | H | 2B | 3B | HR | RBI | BB | SO | SB | AVG | OBP | SLG | OPS |
|---|---|---|---|---|---|---|---|---|---|---|---|---|---|---|---|---|---|---|
| 1 | Nick Zambrotta | IBL Sub Players | 1 | 1 | 0 | 1 | 0 | 0 | 0 | 0 | 1 | 0 | 0 | 1.000 | 1.000 | 1.000 | 2.000 | |
| 2 | Alexander Troum | Reds | 12 | 36 | 14 | 20 | 2 | 0 | 0 | 7 | 0 | 3 | 8 | 0.556 | 0.553 | 0.611 | 1.164 | |
| 3 |  Ryan Kelly Ryan Kelly | Islanders | Outfield | 14 | 36 | 19 | 19 | 6 | 0 | 2 | 21 | 4 | 1 | 5 | 0.528 | 0.646 | 0.861 | 1.507 |
| 4 |  Matt Williams Matt Williams | Islanders | Pitcher, Short Stop | 9 | 21 | 10 | 11 | 2 | 0 | 1 | 9 | 3 | 0 | 1 | 0.524 | 0.583 | 0.762 | 1.345 |
| 5 |  Jarus Samagaio Jarus Samagaio | Storm | Catcher, Outfield, Pitcher | 13 | 32 | 6 | 16 | 1 | 0 | 0 | 9 | 2 | 7 | 3 | 0.500 | 0.543 | 0.531 | 1.074 |
| 6 |  Matt Capone Matt Capone | Storm | Outfield, Pitcher, Third Base | 13 | 30 | 13 | 15 | 5 | 0 | 1 | 11 | 3 | 2 | 1 | 0.500 | 0.615 | 0.767 | 1.382 |
| 7 |  Josh Sokol Josh Sokol | Storm | Outfield, Pitcher | 14 | 39 | 17 | 19 | 3 | 1 | 3 | 7 | 5 | 3 | 7 | 0.487 | 0.565 | 0.846 | 1.411 |
| 8 |  Jimmy Costakos Jimmy Costakos | Storm | First Base, Third Base | 16 | 37 | 11 | 18 | 4 | 0 | 2 | 15 | 8 | 5 | 1 | 0.486 | 0.604 | 0.757 | 1.361 |
| 9 |  Jeff Carreiro Jeff Carreiro | Royals | Outfield | 12 | 35 | 11 | 17 | 2 | 0 | 2 | 6 | 4 | 0 | 2 | 0.486 | 0.538 | 0.714 | 1.253 |
| 10 |  Mike Dougan Mike Dougan | Navs | Pitcher, Short Stop | 13 | 41 | 19 | 19 | 7 | 0 | 1 | 16 | 4 | 6 | 5 | 0.463 | 0.500 | 0.707 | 1.207 |
| 11 |  Alex Desantis Alex Desantis | Royals | 2nd Base, Pitcher, Third Base | 16 | 39 | 16 | 18 | 1 | 0 | 0 | 5 | 5 | 7 | 0 | 0.462 | 0.549 | 0.487 | 1.036 |
| 12 |  Austin Navarro Austin Navarro | Reds | 12 | 27 | 14 | 12 | 2 | 0 | 0 | 6 | 10 | 4 | 3 | 0.444 | 0.605 | 0.519 | 1.124 | |
| 13 |  Andrew Salpietro Andrew Salpietro | Reds | 12 | 32 | 6 | 14 | 4 | 0 | 0 | 9 | 3 | 5 | 2 | 0.438 | 0.500 | 0.563 | 1.063 | |
| 14 |  Joey Sanfilippo Joey Sanfilippo | Islanders | Center field, Pitcher | 15 | 43 | 11 | 18 | 3 | 0 | 1 | 13 | 8 | 5 | 2 | 0.419 | 0.510 | 0.558 | 1.068 |
| 15 |  Wayne Martins Wayne Martins | Reds | 14 | 39 | 5 | 16 | 3 | 0 | 1 | 20 | 3 | 3 | 1 | 0.410 | 0.477 | 0.564 | 1.041 | |
| 16 |  Robbie Harrington Robbie Harrington | Pirates | Catcher, Pitcher, Third Base | 14 | 42 | 7 | 17 | 2 | 0 | 0 | 10 | 3 | 4 | 8 | 0.405 | 0.457 | 0.452 | 0.909 |
| 17 |  Trent Baltzell Trent Baltzell | Royals | Center field | 14 | 35 | 12 | 14 | 1 | 0 | 2 | 12 | 4 | 4 | 9 | 0.400 | 0.500 | 0.600 | 1.100 |
| 18 |  Joe Long Joe Long | Islanders | Catcher, Pitcher | 9 | 23 | 7 | 9 | 0 | 1 | 0 | 6 | 7 | 3 | 5 | 0.391 | 0.516 | 0.478 | 0.994 |
| 19 |  Michael Schuermann Michael Schuermann | Islanders | Outfield, Pitcher | 9 | 26 | 8 | 10 | 2 | 0 | 1 | 3 | 3 | 7 | 7 | 0.385 | 0.467 | 0.577 | 1.044 |
| 20 |  Greg Ferro Greg Ferro | Royals | Catcher, Pitcher, Shortstop, Third Base | 16 | 42 | 8 | 16 | 3 | 0 | 0 | 9 | 8 | 6 | 8 | 0.381 | 0.471 | 0.452 | 0.923 |
| 21 |  Chase Ceglie Chase Ceglie | Pirates | Catcher, Infield | 11 | 32 | 5 | 12 | 1 | 0 | 1 | 10 | 3 | 6 | 0 | 0.375 | 0.444 | 0.500 | 0.944 |
| 22 |  Steve Schneider Steve Schneider | Royals | Catcher, Infield, Outfield, Pitcher | 14 | 35 | 12 | 13 | 3 | 0 | 0 | 6 | 6 | 6 | 2 | 0.371 | 0.477 | 0.457 | 0.934 |
| 23 |  Mike Parente Mike Parente | Reds | 11 | 27 | 4 | 10 | 2 | 0 | 0 | 3 | 2 | 5 | 2 | 0.370 | 0.414 | 0.444 | 0.858 | |
| 24 |  Brandon Dame Brandon Dame | Storm | First Base | 8 | 22 | 3 | 8 | 0 | 0 | 1 | 4 | 1 | 2 | 0 | 0.364 | 0.391 | 0.500 | 0.891 |
| 25 |  CJ Silva CJ Silva | Storm | Infield, Pitcher | 14 | 36 | 9 | 13 | 2 | 0 | 0 | 1 | 8 | 2 | 4 | 0.361 | 0.477 | 0.417 | 0.894 |
| 26 |  Zach Greene Zach Greene | Navs | Left field, Pitcher | 14 | 39 | 20 | 14 | 4 | 0 | 0 | 10 | 12 | 5 | 3 | 0.359 | 0.510 | 0.462 | 0.971 |
| 27 |  Eli Estevez Eli Estevez | Storm | Pitcher, Short Stop | 16 | 42 | 10 | 15 | 8 | 0 | 1 | 7 | 4 | 14 | 9 | 0.357 | 0.413 | 0.619 | 1.032 |
| 28 |  Brian Crea Brian Crea | Navs | Pitcher | 15 | 42 | 14 | 15 | 2 | 0 | 3 | 22 | 10 | 4 | 2 | 0.357 | 0.500 | 0.619 | 1.119 |
| 29 |  Jerry Pelitier Jerry Pelitier | Reds | Pitcher | 8 | 20 | 6 | 7 | 1 | 0 | 0 | 4 | 7 | 5 | 0 | 0.350 | 0.500 | 0.400 | 0.900 |
| 30 |  Jeff Oberg Jeff Oberg | Storm | Catcher, Infield, Outfield | 14 | 33 | 7 | 11 | 0 | 0 | 0 | 3 | 7 | 10 | 7 | 0.333 | 0.476 | 0.333 | 0.810 |
| 31 |  Jeff Rodriguez Jeff Rodriguez | Royals | 2nd Base, Shortstop, Third Base | 14 | 36 | 3 | 12 | 1 | 0 | 0 | 5 | 2 | 5 | 4 | 0.333 | 0.368 | 0.361 | 0.730 |
| 32 |  Alex Dresser Alex Dresser | Pirates | First Base, Outfield | 9 | 18 | 1 | 6 | 1 | 0 | 0 | 2 | 6 | 6 | 2 | 0.333 | 0.500 | 0.389 | 0.889 |
| 33 |  Steve Sanfillippo Steve Sanfillippo | Islanders | First Base | 10 | 27 | 3 | 9 | 0 | 0 | 0 | 7 | 3 | 6 | 0 | 0.333 | 0.419 | 0.333 | 0.753 |
| 34 | Victor Lahr | Islanders | First Base, Outfield, Pitcher | 16 | 46 | 16 | 15 | 6 | 0 | 4 | 16 | 6 | 12 | 1 | 0.326 | 0.426 | 0.717 | 1.143 |
| 35 |  Devin Johnson Devin Johnson | Pirates | Outfield, Pitcher | 14 | 34 | 14 | 11 | 5 | 1 | 2 | 4 | 9 | 9 | 16 | 0.324 | 0.477 | 0.706 | 1.183 |
| 36 |  Teddy Horan Teddy Horan | Pirates | Infield, Pitcher | 13 | 36 | 10 | 11 | 3 | 0 | 0 | 3 | 7 | 9 | 4 | 0.306 | 0.444 | 0.389 | 0.833 |
| 37 |  Shad Samagaio Shad Samagaio | Storm | Catcher, Infield | 12 | 30 | 5 | 9 | 1 | 0 | 0 | 5 | 4 | 9 | 3 | 0.300 | 0.382 | 0.333 | 0.716 |
| 38 |  Gary Vaspol Gary Vaspol | Navs | 15 | 47 | 8 | 14 | 1 | 0 | 2 | 19 | 4 | 9 | 4 | 0.298 | 0.382 | 0.447 | 0.829 | |
| 39 |  Scott Copper Scott Copper | Royals | Pitcher, Shortstop | 11 | 24 | 2 | 7 | 1 | 0 | 0 | 3 | 4 | 6 | 2 | 0.292 | 0.393 | 0.333 | 0.726 |
| 40 |  Matt Bury Matt Bury | Reds | 13 | 31 | 7 | 9 | 0 | 0 | 0 | 4 | 5 | 5 | 0 | 0.290 | 0.389 | 0.290 | 0.679 | |
| 41 |  Russell Forgue Russell Forgue | Navs | First Base, Pitcher | 13 | 31 | 10 | 9 | 1 | 0 | 1 | 8 | 8 | 5 | 0 | 0.290 | 0.452 | 0.419 | 0.872 |
| 42 |  Curtis Cord Curtis Cord | Reds | 12 | 28 | 7 | 8 | 2 | 0 | 0 | 5 | 4 | 6 | 1 | 0.286 | 0.375 | 0.357 | 0.732 | |
| 43 |  Cody Platt Cody Platt | Islanders | Pitcher, Short Stop | 6 | 14 | 5 | 4 | 1 | 0 | 0 | 1 | 4 | 3 | 4 | 0.286 | 0.444 | 0.357 | 0.802 |
| 44 | Ian Smith | Islanders | Shortstop | 5 | 14 | 4 | 4 | 0 | 0 | 1 | 2 | 1 | 4 | 0 | 0.286 | 0.375 | 0.500 | 0.875 |
| 45 |  James Pierce James Pierce | Navs | Pitcher | 13 | 36 | 10 | 10 | 1 | 0 | 0 | 2 | 3 | 6 | 0 | 0.278 | 0.350 | 0.306 | 0.656 |
| 46 | Austin Martin | Pirates | First Base | 11 | 29 | 2 | 8 | 2 | 0 | 0 | 5 | 2 | 3 | 0 | 0.276 | 0.364 | 0.345 | 0.708 |
| 47 |  Andy Lima Andy Lima | Islanders | Outfield | 14 | 37 | 2 | 10 | 1 | 0 | 0 | 6 | 5 | 10 | 4 | 0.270 | 0.372 | 0.297 | 0.669 |
| 48 |  Matt Baker Matt Baker | Reds | 10 | 19 | 5 | 5 | 0 | 0 | 0 | 0 | 2 | 3 | 1 | 0.263 | 0.364 | 0.263 | 0.627 | |
| 49 |  Joseph Cassady Joseph Cassady | Navs | 9 | 19 | 8 | 5 | 1 | 0 | 1 | 5 | 7 | 6 | 0 | 0.263 | 0.462 | 0.474 | 0.935 | |
| 50 |  Alex Croce Alex Croce | Islanders | Outfield, Pitcher | 11 | 31 | 6 | 8 | 0 | 0 | 2 | 8 | 4 | 7 | 7 | 0.258 | 0.343 | 0.452 | 0.794 |
| 51 |  Jake Vaspol Jake Vaspol | Navs | 14 | 36 | 8 | 9 | 0 | 0 | 0 | 8 | 10 | 9 | 0 | 0.250 | 0.438 | 0.250 | 0.688 | |
| 52 |  Chris Perez Chris Perez | Schooners | First Base, Right field | 2 | 4 | 0 | 1 | 0 | 0 | 0 | 0 | 0 | 2 | 0 | 0.250 | 0.400 | 0.250 | 0.650 |
| 53 |  Scott Emond Scott Emond | Pirates | Outfield | 14 | 40 | 4 | 10 | 0 | 0 | 0 | 4 | 1 | 8 | 1 | 0.250 | 0.318 | 0.250 | 0.568 |
| 54 |  Kevin Rinaldi Young Kevin Rinaldi Young | Pirates | Second Base | 14 | 36 | 7 | 9 | 2 | 0 | 0 | 5 | 8 | 9 | 1 | 0.250 | 0.400 | 0.306 | 0.706 |
| 55 | Ryan Fallon | Islanders | 2nd Base, Pitcher | 3 | 8 | 0 | 2 | 0 | 0 | 0 | 1 | 1 | 1 | 0 | 0.250 | 0.333 | 0.250 | 0.583 |
| 56 |  Todd Bartolomei Todd Bartolomei | Navs | Catcher | 15 | 37 | 12 | 9 | 3 | 0 | 1 | 11 | 11 | 7 | 0 | 0.243 | 0.429 | 0.405 | 0.834 |
| 57 |  David Boelter David Boelter | Reds | 12 | 29 | 1 | 7 | 1 | 0 | 0 | 4 | 4 | 7 | 0 | 0.241 | 0.353 | 0.276 | 0.629 | |
| 58 |  Steve Farias Steve Farias | Navs | Pitcher, Third Base | 15 | 38 | 11 | 9 | 1 | 0 | 0 | 4 | 6 | 6 | 0 | 0.237 | 0.370 | 0.263 | 0.633 |
| 59 |  Chris Ferris Chris Ferris | Pirates | First Base | 13 | 31 | 1 | 7 | 0 | 0 | 0 | 3 | 2 | 12 | 0 | 0.226 | 0.294 | 0.226 | 0.520 |
| 60 |  Mike Berardo Mike Berardo | Navs | Second Base | 12 | 23 | 9 | 5 | 0 | 0 | 0 | 4 | 9 | 7 | 0 | 0.217 | 0.457 | 0.217 | 0.675 |
| 61 |  Collin Moriarty Collin Moriarty | Reds | Pitcher | 10 | 19 | 7 | 4 | 0 | 0 | 0 | 2 | 6 | 6 | 0 | 0.211 | 0.385 | 0.211 | 0.595 |
| 62 |  George Grassi George Grassi | Reds | 10 | 15 | 4 | 3 | 0 | 1 | 0 | 5 | 7 | 6 | 0 | 0.200 | 0.478 | 0.333 | 0.812 | |
| 63 |  Chuck Cooper Chuck Cooper | Royals | Right field | 12 | 25 | 3 | 5 | 0 | 0 | 0 | 4 | 3 | 8 | 0 | 0.200 | 0.310 | 0.200 | 0.510 |
| 64 |  Dylan Smith Dylan Smith | Pirates | Pitcher, Short Stop | 9 | 21 | 8 | 4 | 0 | 0 | 2 | 3 | 6 | 7 | 1 | 0.190 | 0.370 | 0.476 | 0.847 |
| 65 |  Josh Schneider Josh Schneider | Royals | Infield, Outfield, Pitcher | 15 | 32 | 6 | 6 | 1 | 0 | 0 | 5 | 7 | 10 | 2 | 0.188 | 0.350 | 0.219 | 0.569 |
| 66 | RJ Ritchie | Islanders | Infield | 9 | 16 | 3 | 3 | 0 | 0 | 0 | 0 | 3 | 3 | 0 | 0.188 | 0.435 | 0.188 | 0.622 |
| 67 |  Mike Rafferty Mike Rafferty | Navs | 12 | 27 | 6 | 5 | 0 | 0 | 0 | 2 | 5 | 12 | 2 | 0.185 | 0.371 | 0.185 | 0.557 | |
| 68 |  Marcelo Aracena Rivera Marcelo Aracena Rivera | Storm | Catcher | 13 | 27 | 2 | 5 | 0 | 0 | 0 | 3 | 5 | 5 | 0 | 0.185 | 0.313 | 0.185 | 0.498 |
| 69 | Zachary Rosenfeld | Islanders | 2nd Base, Right field | 16 | 36 | 4 | 6 | 0 | 0 | 0 | 2 | 7 | 16 | 0 | 0.167 | 0.302 | 0.167 | 0.469 |
| 70 |  DJ Kadamus DJ Kadamus | Islanders | Catcher, Infield, Pitcher | 13 | 34 | 4 | 5 | 1 | 0 | 0 | 1 | 5 | 12 | 0 | 0.147 | 0.256 | 0.176 | 0.433 |
| 71 | Joel DeMarco | - | 4 | 7 | 3 | 1 | 0 | 0 | 0 | 1 | 3 | 1 | 1 | 0.143 | 0.455 | 0.143 | 0.597 | |
| 72 |  Jon Vinas Jon Vinas | Storm | Outfield | 14 | 21 | 4 | 3 | 0 | 0 | 0 | 3 | 16 | 12 | 8 | 0.143 | 0.514 | 0.143 | 0.656 |
| 73 |  Collin Cord Collin Cord | Reds | 11 | 22 | 4 | 3 | 2 | 0 | 0 | 5 | 7 | 13 | 0 | 0.136 | 0.333 | 0.227 | 0.561 | |
| 74 |  Ross Cooper Ross Cooper | Royals | 2nd Base, Outfield | 13 | 31 | 4 | 4 | 0 | 0 | 0 | 1 | 3 | 11 | 1 | 0.129 | 0.206 | 0.129 | 0.335 |
| 75 |  Charles Aboyoun, Sr. Charles Aboyoun, Sr. | Storm | Right field, Third Base | 5 | 8 | 1 | 1 | 0 | 0 | 0 | 0 | 0 | 2 | 0 | 0.125 | 0.125 | 0.125 | 0.250 |
| 76 |  Jose Vinas Vasquez Jose Vinas Vasquez | Storm | Outfield, Pitcher | 14 | 26 | 2 | 3 | 0 | 0 | 0 | 3 | 8 | 8 | 1 | 0.115 | 0.314 | 0.115 | 0.430 |
| 77 |  Paul Dumas Paul Dumas | Storm | Outfield, Pitcher | 16 | 37 | 0 | 4 | 0 | 0 | 0 | 1 | 2 | 23 | 0 | 0.108 | 0.175 | 0.108 | 0.283 |
| 78 |  Rodney Jones Rodney Jones | Schooners | Right field, Third Base | 14 | 29 | 2 | 3 | 0 | 0 | 0 | 3 | 3 | 11 | 0 | 0.103 | 0.257 | 0.103 | 0.361 |
| 79 |  Kai Nanfelt Kai Nanfelt | Royals | Outfield | 5 | 11 | 0 | 1 | 0 | 0 | 0 | 0 | 1 | 4 | 0 | 0.091 | 0.167 | 0.091 | 0.258 |
| 80 |  John Hanks John Hanks | Storm | Outfield | 15 | 34 | 2 | 3 | 0 | 0 | 0 | 1 | 1 | 22 | 0 | 0.088 | 0.162 | 0.088 | 0.250 |
| 81 |  Aaron Prendergast Aaron Prendergast | Royals | First Base, Pitcher | 13 | 31 | 3 | 2 | 0 | 0 | 0 | 1 | 3 | 19 | 0 | 0.065 | 0.194 | 0.065 | 0.259 |
| 82 | Robert Russell | - | 10 | 19 | 3 | 1 | 0 | 0 | 0 | 0 | 2 | 11 | 0 | 0.053 | 0.143 | 0.053 | 0.195 |
Pitching Leaderboard
Rank Player Team G W L S IP H R ER BB SO HR ERA 1  AJ Jorge
Pirates 13 0 0 1 4 2 2 1 1 8 0 2.250 2  Josh Sokol
Storm 7 0 2 0 15 17 13 4 1 17 0 2.400 3  Jacob Frances
Schooners 11 2 0 0 11 4 6 3 2 5 0 2.455 4  Dylan Smith
Pirates 14 4 4 1 38 27 13 11 4 58 0 2.605 5  Preston Walker
Schooners 18 4 1 1 49 26 18 16 12 59 1 2.939 6  Austin Walker
Schooners 16 7 2 1 45 31 22 15 9 34 2 3.000 7  Greg Ferro
Royals 16 0 0 0 9 3 6 3 4 8 0 3.000 8  Brian Crea
Navs 14 7 1 1 49 41 28 17 12 70 5 3.122 9  Charlie Gomez
Islanders 16 0 2 0 13 8 14 5 14 15 0 3.462 10  Eli Estevez
Storm 16 3 5 2 43.1 36 40 17 25 46 0 3.550 11  Jase Samagaio
Storm 15 1 1 0 11 13 12 5 10 13 1 4.091 12  Andrew Salpietro
Reds 7 3 0 0 13 10 8 6 4 18 1 4.154 13  Ben Smith
Pirates 14 1 2 0 19 19 15 9 17 17 0 4.263 14  Russell Forgue
Navs 6 1 0 0 4 4 2 2 1 5 0 4.500 15  Robert Yates
Royals 18 3 5 0 49 15 37 26 22 59 3 4.776 16  Scott Copper
Royals 17 1 0 1 15 3 13 8 7 10 1 4.800 17 Matt Boelter Reds 16 5 3 0 39.2 40 28 21 20 53 0 4.821 18  Corey Lemay
Islanders 18 4 5 0 54 66 69 32 30 53 4 5.333 19  Austin Navarro
Reds 13 0 1 2 28.2 38 25 17 12 22 2 5.426 20  Steve Farias
Navs 17 0 0 1 9 6 6 6 7 7 0 6.000 21 Dan Hannon Storm 17 0 0 0 3 2 3 2 5 5 0 6.000 22 Leo Feliciano Reds 9 2 3 0 27.1 26 28 19 22 45 0 6.310 23  Mike Parente
Reds 16 0 0 0 4 4 6 3 7 3 1 6.750 24  Steve Schneider
Royals 12 0 0 0 4 2 6 3 3 2 0 6.750 25  Robbie Harrington
Pirates 15 1 3 0 37 39 34 29 26 32 3 7.054 26  Garrett Nolan
Schooners 16 1 1 1 5 2 6 4 5 4 1 7.200 27  Dean Spaulding
Islanders 8 2 1 0 10 13 10 8 4 11 1 7.200 28  DJ Kadamus
Islanders 16 0 2 0 18 23 20 15 16 10 1 7.500 29  Jeff Carreiro
Royals 16 0 1 0 12 7 18 11 14 5 0 8.250 30  Alex Croce
Islanders 15 0 0 0 15 25 27 14 8 4 1 8.400 31  Jose Vinas Vasquez
Storm 16 2 1 0 24 37 26 24 17 14 3 9.000 32  Ryan Kelly
Islanders 11 0 1 0 5 4 7 5 6 3 0 9.000 33  Paul Dumas
Storm 14 0 2 0 13 30 16 13 4 12 2 9.000 34  Zach Greene
Navs 16 3 4 1 37.2 58 46 38 14 41 4 9.194 35  Devin Johnson
Pirates 16 1 1 1 15 17 17 17 9 18 0 10.200 36 Liam Griffiths Royals 15 0 3 1 17 13 26 22 17 9 1 11.647 37  Aaron Prendergast
Royals 17 1 1 0 13 4 23 17 7 9 1 11.769 38  Michael Schuermann
Islanders 14 1 0 0 3 3 4 4 6 1 1 12.000 39 Pete Lankarge Navs 13 0 1 0 12.2 20 18 17 6 14 2 12.541 40 Troy Ruggiero Reds 6 0 0 0 2 4 3 3 0 2 0 13.500 41  Drew Nealey
Islanders 12 0 0 0 2 1 6 4 7 3 1 18.000 42  Chris Perez
Schooners 16 0 0 1 1 0 2 2 3 0 0 18.000 43  Anthony Geer
Schooners 15 0 0 0 3 6 9 9 7 3 0 27.000 44  Trent Rogers
Schooners 17 0 0 0 2 0 5 8 5 0 0 36.000 45  Kevin Rinaldi Young
Pirates 15 0 0 0 1 1 4 4 2 0 0 36.000 46  Matt Baker
Reds 14 0 0 0 0.1 0 3 3 1 0 0 270.000
Pitching Leaderboard
| Rank | Player | Team | G | W | L | S | IP | H | R | ER | BB | SO | HR | ERA |
|---|---|---|---|---|---|---|---|---|---|---|---|---|---|---|
| 1 |  AJ Jorge AJ Jorge | Pirates | 13 | 0 | 0 | 1 | 4 | 2 | 2 | 1 | 1 | 8 | 0 | 2.250 |
| 2 |  Josh Sokol Josh Sokol | Storm | 7 | 0 | 2 | 0 | 15 | 17 | 13 | 4 | 1 | 17 | 0 | 2.400 |
| 3 |  Jacob Frances Jacob Frances | Schooners | 11 | 2 | 0 | 0 | 11 | 4 | 6 | 3 | 2 | 5 | 0 | 2.455 |
| 4 |  Dylan Smith Dylan Smith | Pirates | 14 | 4 | 4 | 1 | 38 | 27 | 13 | 11 | 4 | 58 | 0 | 2.605 |
| 5 |  Preston Walker Preston Walker | Schooners | 18 | 4 | 1 | 1 | 49 | 26 | 18 | 16 | 12 | 59 | 1 | 2.939 |
| 6 |  Austin Walker Austin Walker | Schooners | 16 | 7 | 2 | 1 | 45 | 31 | 22 | 15 | 9 | 34 | 2 | 3.000 |
| 7 |  Greg Ferro Greg Ferro | Royals | 16 | 0 | 0 | 0 | 9 | 3 | 6 | 3 | 4 | 8 | 0 | 3.000 |
| 8 |  Brian Crea Brian Crea | Navs | 14 | 7 | 1 | 1 | 49 | 41 | 28 | 17 | 12 | 70 | 5 | 3.122 |
| 9 |  Charlie Gomez Charlie Gomez | Islanders | 16 | 0 | 2 | 0 | 13 | 8 | 14 | 5 | 14 | 15 | 0 | 3.462 |
| 10 |  Eli Estevez Eli Estevez | Storm | 16 | 3 | 5 | 2 | 43.1 | 36 | 40 | 17 | 25 | 46 | 0 | 3.550 |
| 11 |  Jase Samagaio Jase Samagaio | Storm | 15 | 1 | 1 | 0 | 11 | 13 | 12 | 5 | 10 | 13 | 1 | 4.091 |
| 12 |  Andrew Salpietro Andrew Salpietro | Reds | 7 | 3 | 0 | 0 | 13 | 10 | 8 | 6 | 4 | 18 | 1 | 4.154 |
| 13 |  Ben Smith Ben Smith | Pirates | 14 | 1 | 2 | 0 | 19 | 19 | 15 | 9 | 17 | 17 | 0 | 4.263 |
| 14 |  Russell Forgue Russell Forgue | Navs | 6 | 1 | 0 | 0 | 4 | 4 | 2 | 2 | 1 | 5 | 0 | 4.500 |
| 15 |  Robert Yates Robert Yates | Royals | 18 | 3 | 5 | 0 | 49 | 15 | 37 | 26 | 22 | 59 | 3 | 4.776 |
| 16 |  Scott Copper Scott Copper | Royals | 17 | 1 | 0 | 1 | 15 | 3 | 13 | 8 | 7 | 10 | 1 | 4.800 |
| 17 | Matt Boelter | Reds | 16 | 5 | 3 | 0 | 39.2 | 40 | 28 | 21 | 20 | 53 | 0 | 4.821 |
| 18 |  Corey Lemay Corey Lemay | Islanders | 18 | 4 | 5 | 0 | 54 | 66 | 69 | 32 | 30 | 53 | 4 | 5.333 |
| 19 |  Austin Navarro Austin Navarro | Reds | 13 | 0 | 1 | 2 | 28.2 | 38 | 25 | 17 | 12 | 22 | 2 | 5.426 |
| 20 |  Steve Farias Steve Farias | Navs | 17 | 0 | 0 | 1 | 9 | 6 | 6 | 6 | 7 | 7 | 0 | 6.000 |
| 21 | Dan Hannon | Storm | 17 | 0 | 0 | 0 | 3 | 2 | 3 | 2 | 5 | 5 | 0 | 6.000 |
| 22 | Leo Feliciano | Reds | 9 | 2 | 3 | 0 | 27.1 | 26 | 28 | 19 | 22 | 45 | 0 | 6.310 |
| 23 |  Mike Parente Mike Parente | Reds | 16 | 0 | 0 | 0 | 4 | 4 | 6 | 3 | 7 | 3 | 1 | 6.750 |
| 24 |  Steve Schneider Steve Schneider | Royals | 12 | 0 | 0 | 0 | 4 | 2 | 6 | 3 | 3 | 2 | 0 | 6.750 |
| 25 |  Robbie Harrington Robbie Harrington | Pirates | 15 | 1 | 3 | 0 | 37 | 39 | 34 | 29 | 26 | 32 | 3 | 7.054 |
| 26 |  Garrett Nolan Garrett Nolan | Schooners | 16 | 1 | 1 | 1 | 5 | 2 | 6 | 4 | 5 | 4 | 1 | 7.200 |
| 27 |  Dean Spaulding Dean Spaulding | Islanders | 8 | 2 | 1 | 0 | 10 | 13 | 10 | 8 | 4 | 11 | 1 | 7.200 |
| 28 |  DJ Kadamus DJ Kadamus | Islanders | 16 | 0 | 2 | 0 | 18 | 23 | 20 | 15 | 16 | 10 | 1 | 7.500 |
| 29 |  Jeff Carreiro Jeff Carreiro | Royals | 16 | 0 | 1 | 0 | 12 | 7 | 18 | 11 | 14 | 5 | 0 | 8.250 |
| 30 |  Alex Croce Alex Croce | Islanders | 15 | 0 | 0 | 0 | 15 | 25 | 27 | 14 | 8 | 4 | 1 | 8.400 |
| 31 |  Jose Vinas Vasquez Jose Vinas Vasquez | Storm | 16 | 2 | 1 | 0 | 24 | 37 | 26 | 24 | 17 | 14 | 3 | 9.000 |
| 32 |  Ryan Kelly Ryan Kelly | Islanders | 11 | 0 | 1 | 0 | 5 | 4 | 7 | 5 | 6 | 3 | 0 | 9.000 |
| 33 |  Paul Dumas Paul Dumas | Storm | 14 | 0 | 2 | 0 | 13 | 30 | 16 | 13 | 4 | 12 | 2 | 9.000 |
| 34 |  Zach Greene Zach Greene | Navs | 16 | 3 | 4 | 1 | 37.2 | 58 | 46 | 38 | 14 | 41 | 4 | 9.194 |
| 35 |  Devin Johnson Devin Johnson | Pirates | 16 | 1 | 1 | 1 | 15 | 17 | 17 | 17 | 9 | 18 | 0 | 10.200 |
| 36 | Liam Griffiths | Royals | 15 | 0 | 3 | 1 | 17 | 13 | 26 | 22 | 17 | 9 | 1 | 11.647 |
| 37 |  Aaron Prendergast Aaron Prendergast | Royals | 17 | 1 | 1 | 0 | 13 | 4 | 23 | 17 | 7 | 9 | 1 | 11.769 |
| 38 |  Michael Schuermann Michael Schuermann | Islanders | 14 | 1 | 0 | 0 | 3 | 3 | 4 | 4 | 6 | 1 | 1 | 12.000 |
| 39 | Pete Lankarge | Navs | 13 | 0 | 1 | 0 | 12.2 | 20 | 18 | 17 | 6 | 14 | 2 | 12.541 |
| 40 | Troy Ruggiero | Reds | 6 | 0 | 0 | 0 | 2 | 4 | 3 | 3 | 0 | 2 | 0 | 13.500 |
| 41 |  Drew Nealey Drew Nealey | Islanders | 12 | 0 | 0 | 0 | 2 | 1 | 6 | 4 | 7 | 3 | 1 | 18.000 |
| 42 |  Chris Perez Chris Perez | Schooners | 16 | 0 | 0 | 1 | 1 | 0 | 2 | 2 | 3 | 0 | 0 | 18.000 |
| 43 |  Anthony Geer Anthony Geer | Schooners | 15 | 0 | 0 | 0 | 3 | 6 | 9 | 9 | 7 | 3 | 0 | 27.000 |
| 44 |  Trent Rogers Trent Rogers | Schooners | 17 | 0 | 0 | 0 | 2 | 0 | 5 | 8 | 5 | 0 | 0 | 36.000 |
| 45 |  Kevin Rinaldi Young Kevin Rinaldi Young | Pirates | 15 | 0 | 0 | 0 | 1 | 1 | 4 | 4 | 2 | 0 | 0 | 36.000 |
| 46 |  Matt Baker Matt Baker | Reds | 14 | 0 | 0 | 0 | 0.1 | 0 | 3 | 3 | 1 | 0 | 0 | 270.000 |